Performance & Profiling
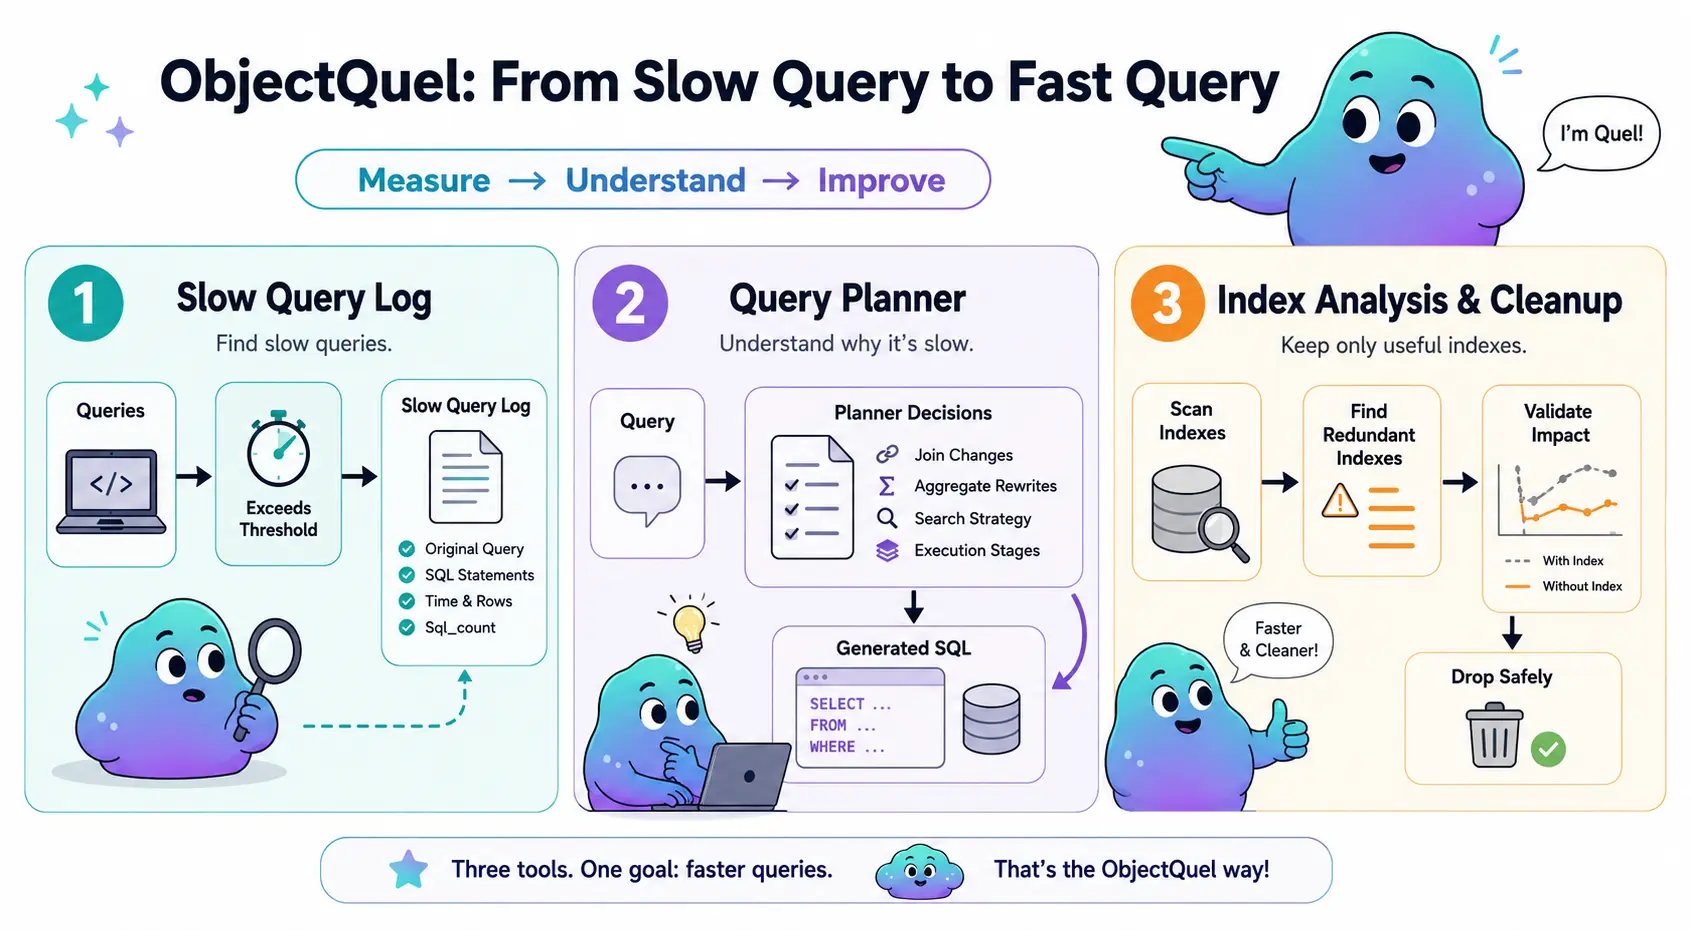
ObjectQuel provides three complementary tools for measuring and improving query performance: a slow query log that records every query exceeding a time threshold, a query planner that explains the optimization decisions made before SQL reaches the database, and an index analysis command that identifies redundant indexes and guides safe removal. Used together, they give you a complete path from identifying a slow query to understanding why it is slow to fixing it.
Slow Query Log
The slow query log writes an entry for every ObjectQuel query that takes longer than a configurable threshold. Each entry records the original ObjectQuel expression, every SQL statement generated for it, the total execution time, and the number of rows returned.
Configuration
Enable the log in config/database.php by setting slow_query_log
to an absolute file path. Set slow_query_threshold to the minimum execution
time in seconds that should trigger an entry. A threshold of 0.0 logs every
query regardless of duration, which is useful during development:
// config/database.php
return [
    // ... connection settings ...

    // Absolute path to the log file. Set to null to disable.
    'slow_query_log'       => '/var/log/objectquel-slow.log',

    // Minimum execution time in seconds. 0.0 logs every query.
    'slow_query_threshold' => 1.0,
];
The log file is created automatically on first write. The directory must be writable by the web server process. Logging adds negligible overhead when no queries meet the threshold; the file is only opened when a query qualifies.
Log Format
Each entry follows the MySQL slow query log convention so the format is immediately
familiar. A blank line separates entries. The ObjectQuel header line
contains the original query expression; everything below the last header line is
generated SQL:
# ObjectQuel: range of u is App\Entity\UserEntity retrieve (u) where u.active = true
# Time: 2024-01-15T10:23:45+00:00
# Query_time: 1.234567  Rows_sent: 42  Sql_count: 1
SELECT `main`.`id`, `main`.`username`, `main`.`email`
FROM `users` AS `main`
WHERE `main`.`active` = 1;
When ObjectQuel decomposes a query into multiple SQL statements — for example when a
temporary table is required for a JSON range — all statements appear as separate lines
in the body, and Sql_count reflects the total. The reported
Query_time covers the entire operation including hydration, not just the
first SQL statement.
# ObjectQuel: range of u is App\Entity\UserEntity range of src is :jsonData retrieve (u, src.label) where u.id = src.userId
# Time: 2024-01-15T10:24:10+00:00
# Query_time: 2.105432  Rows_sent: 10  Sql_count: 2
INSERT INTO _tmp_abc123 VALUES (...);
SELECT `main`.`id`, `main`.`username`, `_tmp_abc123`.`label`
FROM `users` AS `main`
INNER JOIN `_tmp_abc123` ON `_tmp_abc123`.`userId` = `main`.`id`;
What to Look For
High Query_time with low Rows_sent is the most common warning
sign — it usually means the database scanned many rows to produce few results, which
points to a missing index. High Sql_count with low individual times can
indicate an N+1 pattern: a query inside a loop that should instead be a single joined
query. Once you have identified a candidate, use the query planner to understand exactly
what ObjectQuel generated and why.
Query Planner
The query planner runs before every query and records every optimization decision it makes: which joins were promoted from LEFT to INNER, which aggregates were rewritten as subqueries or window functions, which search strategy was chosen, and how the query was decomposed into execution stages. In normal operation these decisions are silent. Development mode makes them visible.
Enabling Development Mode
Set development_mode to true in config/database.php:
return [
    // ... connection settings ...
    'development_mode' => true,
];
When development mode is active, every query emits a debug signal containing the full query plan and generated SQL. The Canvas Inspector consumes this signal and displays it in the panel below each query. Development mode also runs a dry-run planning pass per query, which adds overhead — enable it temporarily to diagnose a problem, then disable it again.
Reading the Plan
Each plan note records which pipeline stage made the decision (source),
the type of decision (category: join, aggregate,
search, or stage), the specific outcome (decision),
and a plain-English explanation (reason).
The decisions most relevant to performance work are:
- LEFT_TO_INNER — a LEFT JOIN was promoted to INNER because the WHERE clause references a non-nullable field on that range. INNER JOIN is cheaper; if you see LEFT_UNCHANGED on a range you expected to be promoted, check whether your WHERE condition references a nullable column.
- UNUSED_JOIN_REMOVED — a range was joined but never referenced in SELECT, WHERE, or ORDER BY, so it was dropped entirely. If a join you wrote is silently disappearing, this is why.
- SUBQUERY vs WINDOW vs DIRECT — how an aggregate was implemented. SUBQUERY is the most expensive of the three. If you see SUBQUERY on a COUNT or SUM and performance matters, check whether restructuring the query to a single primary range would allow DIRECT or WINDOW instead.
-
FULLTEXT vs LIKE — whether a
search()call resolved to a FULLTEXT index or fell back to a LIKE scan. LIKE on large text columns is expensive. If you see LIKE and the column is large, add a@FullTextIndexannotation and run migrations. - TEMP_TABLE — a range required materialization into a temporary table before the main query could run. This is expected for JSON ranges but worth noting in the context of overall query time.
For the complete decision reference — all decisions, what triggers each one, and
programmatic access via explainQuery() — see the
Query Planner reference.
Index Analysis & Cleanup
quel:analyze-indexes scans every table in the database and reports indexes
that are made redundant by another index on the same table. Run it periodically to find
candidates for removal — redundant indexes waste write overhead without contributing to
query performance:
php bin/sculpt quel:analyze-indexes
The command produces a table with one row per index. The Status column
shows the verdict:
- ok — the index is not redundant.
- Duplicate of <index> — covers the exact same columns in the same order as another index. Safe to drop.
- Prefix of <index> (<columns>) — covered by a wider index whose leading columns are identical. The wider index already satisfies every lookup this one could serve.
Primary key indexes are never flagged. On MySQL and MariaDB, Reads and
Writes columns are appended showing how often each index has been accessed
since the last server restart, drawn from
performance_schema.table_io_waits_summary_by_index_usage. A structurally
redundant index with zero reads and zero writes is a confident removal candidate; one
with non-zero reads warrants further investigation. The usage columns are omitted if
performance_schema is disabled.
Removing an Index Safely
Dropping an index is permanent. Before committing, use quel:index-hide to
make the index invisible to the optimizer while the engine continues maintaining it.
If queries slow down, quel:index-show restores visibility instantly — no
rebuild, no downtime. The recommended workflow:
# 1. Identify redundant indexes
php bin/sculpt quel:analyze-indexes

# 2. Hide a candidate before dropping it
php bin/sculpt quel:index-hide OrderLine idx_created_at

# 3. Run the application under realistic load; watch the slow query log

# 4a. No regressions? Remove the annotation and drop permanently
php bin/sculpt make:migrations
php bin/sculpt quel:migrate

# 4b. Regressions? Restore in one command
php bin/sculpt quel:index-show OrderLine idx_created_at
Applying Index Changes
After adding or modifying index annotations, generate and apply the migration:
php bin/sculpt make:migrations
php bin/sculpt quel:migrate